Database초보우낙
21. 아카이브 로그 파일이 꽉 찼는지 편하게 시각화해서 모니터링 본문
구현1. DB모드를 아카이브 모드로 변환
#1. archive log list

#2. shutdown immediate
#3. startup mount
#4. alter database archivelog;

#5. alter database open;

#6. archive log list

현재 아카이브 로그 파일이 생성되었는지 확인
#아카이브 로그파일 확인
select name from v$archived_log;
#결과 없음

#로그 스위치 발생
alter system switch logfile;
alter system switch logfile;
alter system switch logfile;

#아카이브 로그파일 확인
select name from v$archived_log;
select name from v$archived_log;

아카이브 로그 파일이 생성되는 fast recovery area 영역의 사용율을 확인하시오 !
SELECT
    NAME,
    SPACE_LIMIT / 1024 / 1024 AS "Total Space (MB)",
    SPACE_USED / 1024 / 1024 AS "Space Used (MB)"
FROM
    V$RECOVERY_FILE_DEST;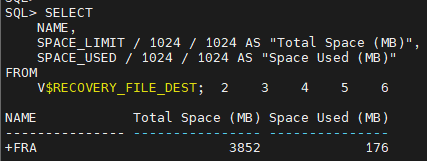
SELECT
    NAME,
    SPACE_LIMIT / 1024 / 1024 AS "Total Space (MB)",
    SPACE_USED / 1024 / 1024 AS "Space Used (MB)",
    ROUND((SPACE_USED / SPACE_LIMIT) * 100, 2) AS "Usage Percentage (%)"
FROM
    V$RECOVERY_FILE_DEST;
위의 결과를 세로로 출력하는 프로시져를 생성하시오
create  or  replace  procedure   fra
is
 v_pct        number(10,2);
begin
SELECT   ROUND((SPACE_USED / SPACE_LIMIT) * 100, 2)   into  v_pct
FROM
    V$RECOVERY_FILE_DEST;
dbms_output.put_line( v_pct );
end;
/
위의 프로시져를 호출하여 출력하는 쉘 스크립트를 작성하시오
connect  /  as sysdba
grant  select  on v_$recovery_file_dest  to  scott;
connect  scott/tiger
create  or  replace  procedure   fra
is
 v_pct        number(10,2);
begin
SELECT   ROUND((SPACE_USED / SPACE_LIMIT) * 100, 2)   into  v_pct
FROM
    V$RECOVERY_FILE_DEST;
dbms_output.put_line( v_pct );
end;
/
fra.sh 스크립트를 생성 -> vi fra.sh
fra.sh 권한 부여 -> chmod 777 fra.sh
#!/bin/bash
export ORACLE_BASE=/u01/app/oracle
export ORACLE_SID=orcl
export ORACLE_HOME=/u01/app/oracle/product/11.2.0/dbhome_1
export PATH=$ORACLE_HOME/bin:$PATH

username="scott"
password="tiger"

sqlplus -s $username/$password <<EOF
set  serveroutput on
set feedback off
exec  fra;
exit;
fra.sh 스크립트를 실행 -> sh fra.sh

위의 shell script 를 파이썬에서 호출하여 출력하시오
import paramiko   # SSH 접속을 위한 라이브러리를 임폴트 합니다.

# 리눅스 서버 정보
hostname = '192.168.56.104'    # 서버의 접속 가능한 IP 주소
username = 'oracle'            # 접속할 유져명
password = 'oracle'            # 접속할 유져의 패스워드

# bash 스크립트의 경로
script_path = "/home/oracle/fra.sh"  # 실행할 bash 스크립트의 경로입니다.

# SSH 클라이언트 객체 생성
ssh = paramiko.SSHClient()  # ssh 클라이언트 객체를 생성합니다.
ssh.set_missing_host_key_policy(paramiko.AutoAddPolicy())
# host key policy 를 자동으로  추가하도록 설정합니다.

# 리눅스 서버에 접속
ssh.connect(hostname, username=username, password=password)

# bash 스크립트를 실행하고 그 결과를 저장합니다.
stdin, stdout, stderr = ssh.exec_command(f'sh {script_path}')

# 결과를 바이트에서 문자열로 디코드
output = stdout.read().decode('utf-8')

# 줄바꿈 문자를 기준으로 문자열을 분할하여 리스트로 변환
output_list = output.split('\n')

# 마지막 요소가 빈 문자열일 경우 제거
if output_list[-1] == '':
    output_list.pop()

# 리스트 출력
print(output_list)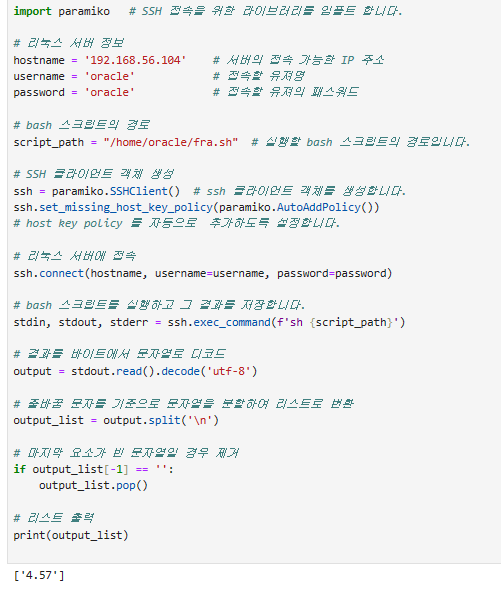
원형 그래프를 그리는 파이썬 코드를 작성합니다.
import matplotlib.pyplot as plt

# 사용된 FRA 비율
used_percentage = 4.57 #나한테 나온 결과값 입력

# 원형 그래프 데이터
sizes = [used_percentage, 100 - used_percentage]  # 사용된 부분과 남은 부분
labels = ['Used', 'Free']
colors = ['#ff9999','#66b3ff']  # 색상 선택

# 원형 그래프 생성 (여기서 그래프 크기를 조정합니다)
plt.figure(figsize=(4, 4))  # 그래프 크기를 작게 설정 (이전에는 7x7이었음)
plt.pie(sizes, labels=labels, colors=colors, autopct='%1.1f%%', startangle=90)
plt.axis('equal')  # 원형 유지를 위해 같은 축 스케일 사용

# 원형 그래프 표시
plt.title('FRA Usage')
plt.show()
원형 그래프를 그리는 파이썬 코드를 작성합니다.
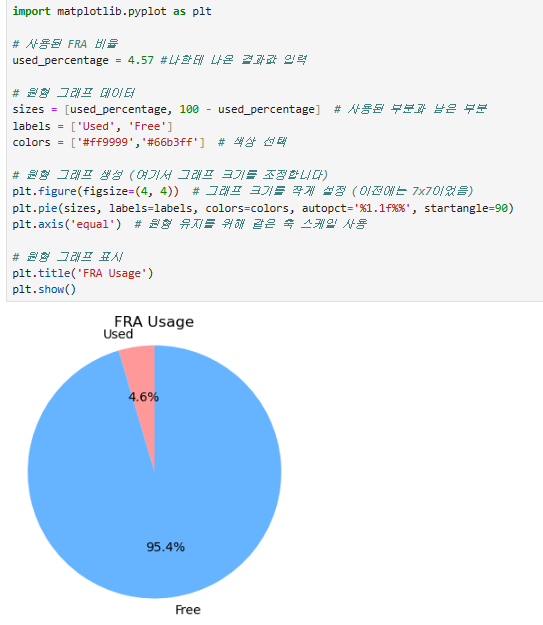
지금까지의 파이썬 코드를 합쳐서 현재 database의 fast recovery area영역의 사용율이 원형 그래프로 나오게 하세요
import paramiko

# 리눅스 서버 정보
hostname = '192.168.56.104'
username = 'oracle'
password = 'oracle'

# bash 스크립트의 경로
script_path = "/home/oracle/fra.sh"

# SSH 클라이언트 객체 생성
ssh = paramiko.SSHClient()
ssh.set_missing_host_key_policy(paramiko.AutoAddPolicy())
ssh.connect(hostname, username=username, password=password)

# bash 스크립트를 실행
stdin, stdout, stderr = ssh.exec_command(f'sh {script_path}')


# 결과 읽기
output = stdout.read().decode('utf-8')

# 에러 메시지 읽기
error = stderr.read().decode('utf-8')


# 줄바꿈 문자를 기준으로 문자열을 분할하여 리스트로 변환
output_list = output.split('\n')
if output_list[-1] == '':
    output_list.pop()

# 결과 리스트 출력
print(output_list[0])

## 원형 그래프 그리는 코드

import matplotlib.pyplot as plt  # 그래프 그리는 전문 모듈

# 사용된 FRA 비율
used_percentage =  float(output_list[0])

# 원형 그래프 데이터
sizes = [used_percentage, 100 - used_percentage]  # 사용된 부분과 남은 부분
labels = ['Used', 'Free']
colors = ['#ff9999','#66b3ff']  # 색상 선택

# 원형 그래프 생성 (여기서 그래프 크기를 조정합니다)
plt.figure(figsize=(4, 4))  # 그래프 크기를 작게 설정 (이전에는 7x7이었음)
plt.pie(sizes, labels=labels, colors=colors, autopct='%1.1f%%', startangle=90)
plt.axis('equal')  # 원형 유지를 위해 같은 축 스케일 사용

# 원형 그래프 표시
plt.title('Oracle Fast recovery area usage')
plt.show()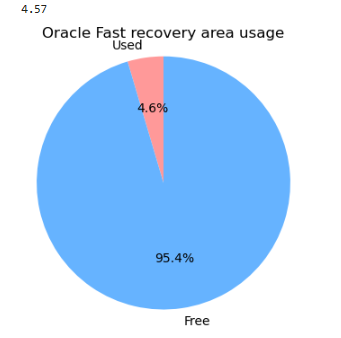
alter system switch logfile; 여러번 일으키고 확인해보기
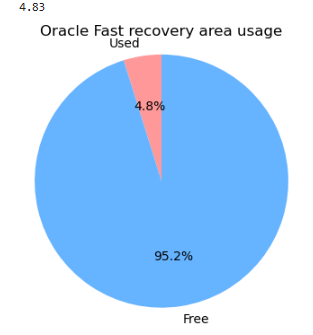
스크립트 3번에 해당내용 추가하기
while True:
    print(""" ===  dba 작업을 편하게 수행하기 위한 스크립트 총모음 ====

                0.   프로그램을 종료하려면 0번을 누르세요.
                1.   alert log file 을 분석해서 로그 스위치 주기 확인
                2.   alert log file에서 가장 많이 나오는 에러번호와 그 건수 확인
                3.   fast recovery area영역의 사용율을 확인하려면 3번을 누르세요
        """)

    num = int(input('원하는 번호를 입력하세요 ~'))
    if num == 0:
        break

    elif num == 1:
        import paramiko   # SSH 접속을 위한 라이브러리를 임폴트 합니다.

        # 리눅스 서버 정보
        hostname = '192.168.56.104'    # 서버의 접속 가능한 IP 주소
        username = 'oracle'            # 접속할 유져명
        password = 'oracle'            # 접속할 유져의 패스워드

        # bash 스크립트의 경로
        script_path = "/home/oracle/a.sh"  # 실행할 bash 스크립트의 경로입니다.

        # SSH 클라이언트 객체 생성
        ssh = paramiko.SSHClient()  # ssh 클라이언트 객체를 생성합니다.
        ssh.set_missing_host_key_policy(paramiko.AutoAddPolicy())
        # host key policy 를 자동으로  추가하도록 설정합니다.

        # 리눅스 서버에 접속
        ssh.connect(hostname, username=username, password=password)

        # bash 스크립트를 실행하고 그 결과를 저장합니다.
        stdin, stdout, stderr = ssh.exec_command(f'sh {script_path}')

        # 결과를 바이트에서 문자열로 디코드
        output = stdout.read().decode('utf-8')

        # 줄바꿈 문자를 기준으로 문자열을 분할하여 리스트로 변환
        output_list = output.split('\n')

        # 마지막 요소가 빈 문자열일 경우 제거
        if output_list[-1] == '':
            output_list.pop()

        import  pandas  as  pd

        df = pd.DataFrame(output_list, columns=['col1'])
        df['col1'] = pd.to_datetime(df['col1'])  # 문자형을 날짜형으로 변환합니다.
        df['time_diff'] = df['col1'].diff()  # time_diff 라는 컬럼을 추가하는데
        print(df)
        break
    elif num == 2:
        file = open('C:\\test\\alert_orcl.log', 'r')
        text = file.read()

        text2 = text.split() # 문자열을 어절별로 분리해서 text2 리스트를 구성
        k = []
        for i in text2:  # 리스트의 요소를 하나씩 불러오는데
            if 'ora-' in i.lower():  # 요소를 소문자로 변환하고 그 요소가 ora- 를 포함하면
                k.append(i)   # k 리스트의 요소로 i 에 들어있는 값을 추가합니다.

        import pandas as pd

        df = pd.DataFrame(k, columns=['col1'])  # k 리스트를 가지고 df 라는 판다스 데이터
        df                                      # 프레임을 생성하는데 컬럼을 col1 으로 지정

        from pandasql import sqldf
        pysqldf = lambda q: sqldf(q, globals())
        q = """select col1, count(*)
                from df
                group by col1
                order by 2 desc;"""

        print(pysqldf(q))
        break
    elif num == 3:
        import paramiko

        # 리눅스 서버 정보
        hostname = '192.168.56.104'
        username = 'oracle'
        password = 'oracle'

        # bash 스크립트의 경로
        script_path = "/home/oracle/fra.sh"

        # SSH 클라이언트 객체 생성
        ssh = paramiko.SSHClient()
        ssh.set_missing_host_key_policy(paramiko.AutoAddPolicy())
        ssh.connect(hostname, username=username, password=password)

        # bash 스크립트를 실행
        stdin, stdout, stderr = ssh.exec_command(f'sh {script_path}')


        # 결과 읽기
        output = stdout.read().decode('utf-8')

        # 에러 메시지 읽기
        error = stderr.read().decode('utf-8')


        # 줄바꿈 문자를 기준으로 문자열을 분할하여 리스트로 변환
        output_list = output.split('\n')
        if output_list[-1] == '':
            output_list.pop()

        # 결과 리스트 출력
        print(output_list[0])

        ## 원형 그래프 그리는 코드

        import matplotlib.pyplot as plt  # 그래프 그리는 전문 모듈

        # 사용된 FRA 비율
        used_percentage = float(output_list[0])

        # 원형 그래프 데이터
        sizes = [used_percentage, 100 - used_percentage]  # 사용된 부분과 남은 부분
        labels = ['Used', 'Free']
        colors = ['#ff9999','#66b3ff']  # 색상 선택

        # 원형 그래프 생성 (여기서 그래프 크기를 조정합니다)
        plt.figure(figsize=(4, 4))  # 그래프 크기를 작게 설정 (이전에는 7x7이었음)
        plt.pie(sizes, labels=labels, colors=colors, autopct='%1.1f%%', startangle=90)
        plt.axis('equal')  # 원형 유지를 위해 같은 축 스케일 사용

        # 원형 그래프 표시
        plt.title('Oracle Fast recovery area usage')
        plt.show()
        break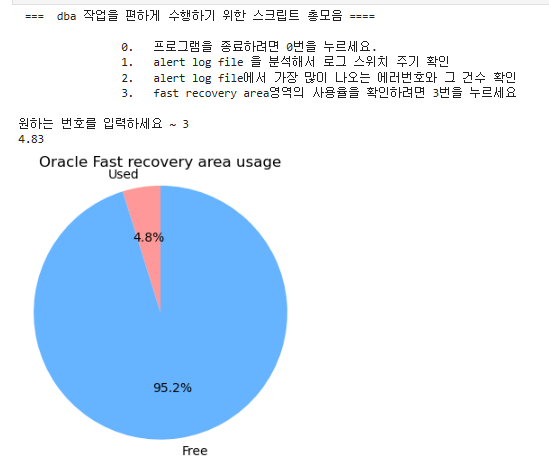
'파이썬' 카테고리의 다른 글
| 23. 오라클 성능 분석 툴 lab128 설치 (0) | 2024.04.22 |
|---|---|
| 예제22. 테이블 스페이스의 사용량 시각화 구현하기 (미완성) (0) | 2024.04.22 |
| 20. 파이썬으로 alert log file 분석하기 1 (0) | 2024.04.17 |
| 19. 파이썬의 문자열 함수를 이용하여 alert logfile 분석하기 (0) | 2024.04.17 |
| 18. 오라클의 alert log file을 파이썬에서 출력하기 (0) | 2024.04.16 |


